Edgemontel
Redesign of SMHI’s map system Edgemontel
- Role
- UX/UI Designer
- Organisation
- SMHI
- Sector
- Energy
- Timeframe
- 2 months, 2026
- Team
- Solo
- Deliverable
- High-fidelity design
- Problem
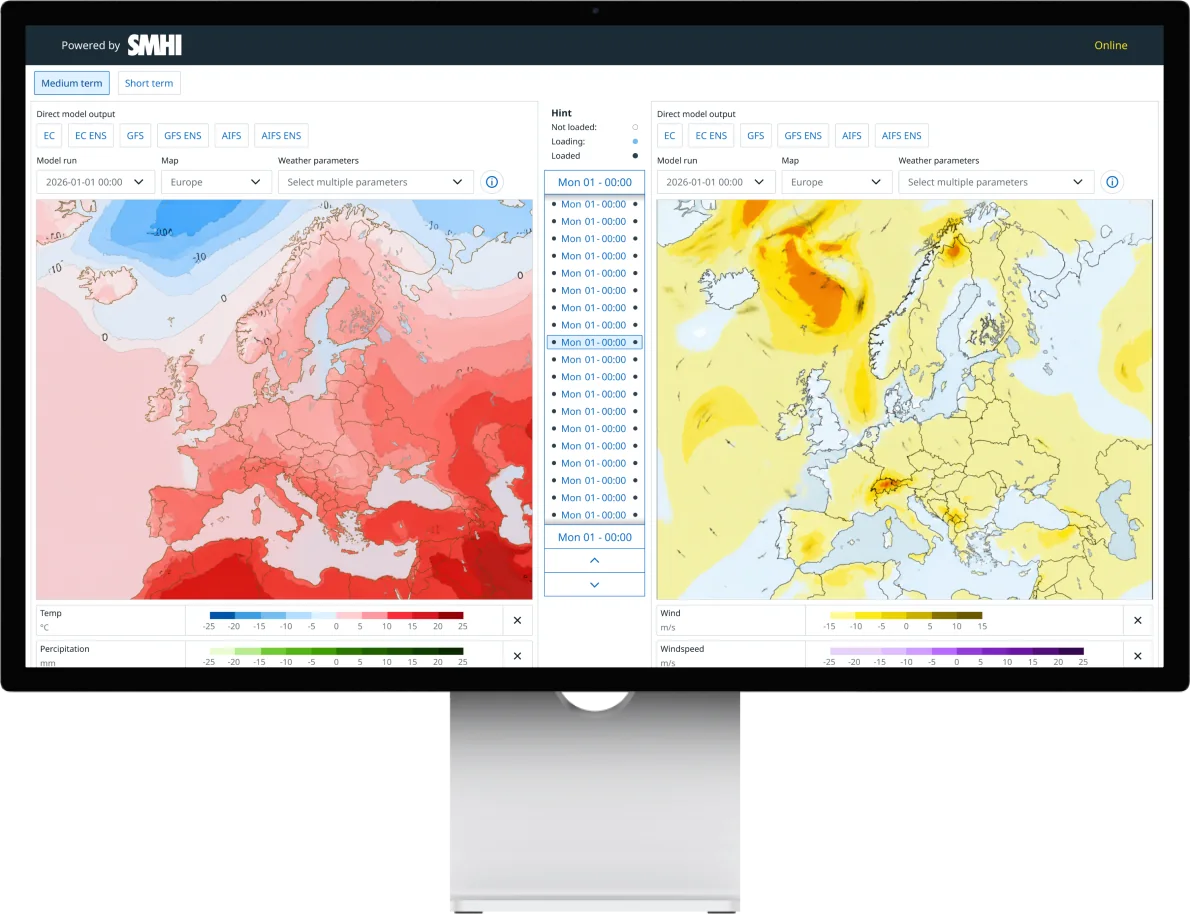
- SMHI’s map service Edgemontel was nearing end of life and was to be replaced with the same functionality, but in the Aurora design system.
- My role
- UX/UI designer, working alone during my internship at SMHI (2 months).
- What I did
- New components based on Aurora’s principles: legends, a control panel and a time slider for 80+ time values.
- Result
- A responsive high-fidelity design with dark mode, handed over to development.
01 Background
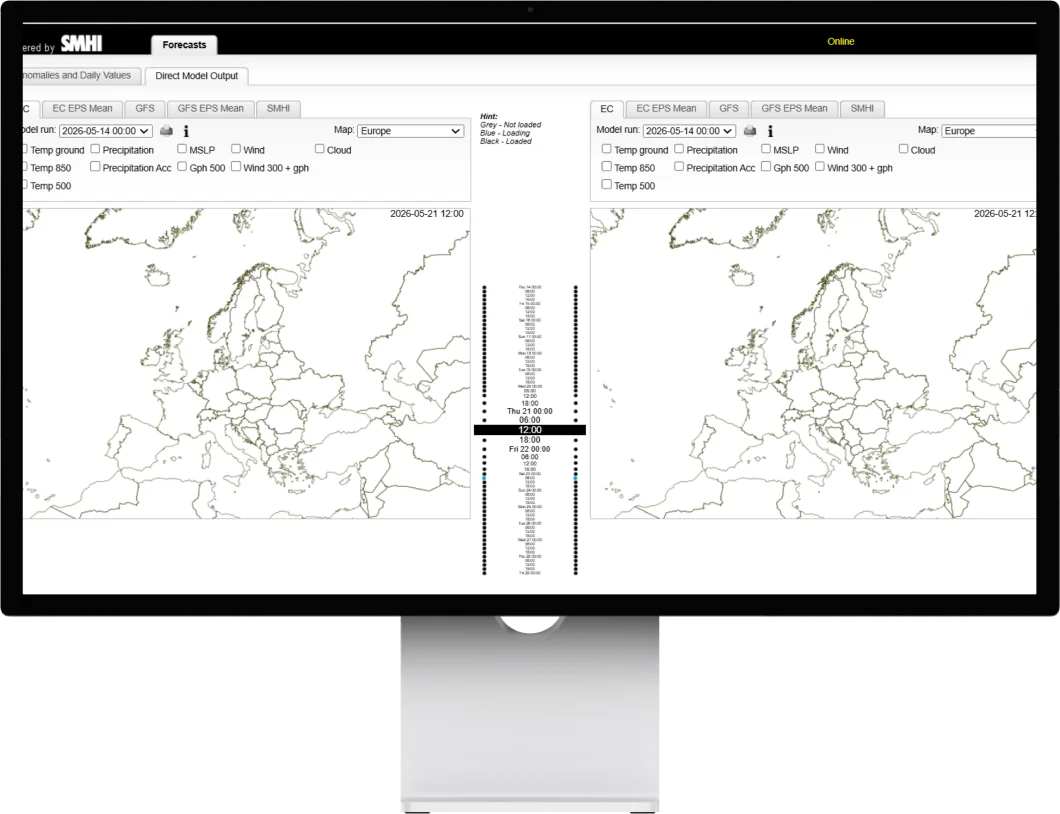
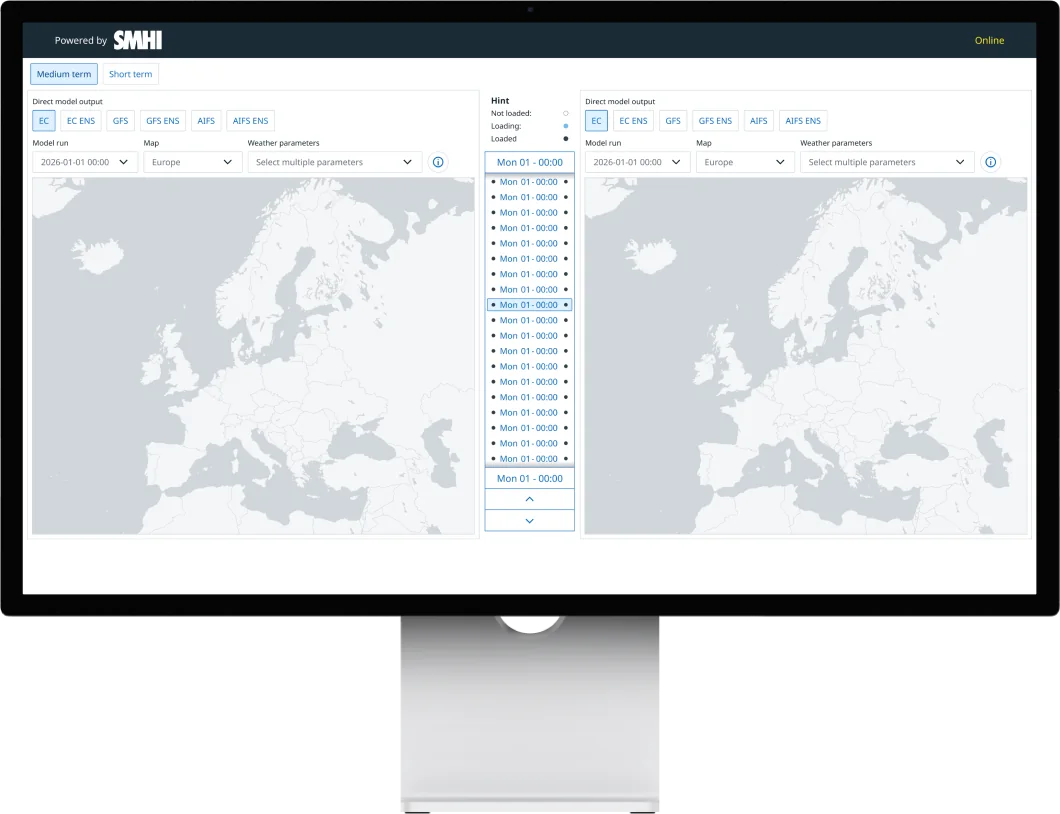
Edgemontel is used by energy market experts, who read advanced weather maps to decide when to trade energy, and by meteorologists who prepare forecast material. The service was nearing end of life. The new version was to have the same performance and functionality, more content, and be built in SMHI’s design system Aurora.
02 Design decisions
Three decisions shaped the design.
Legends
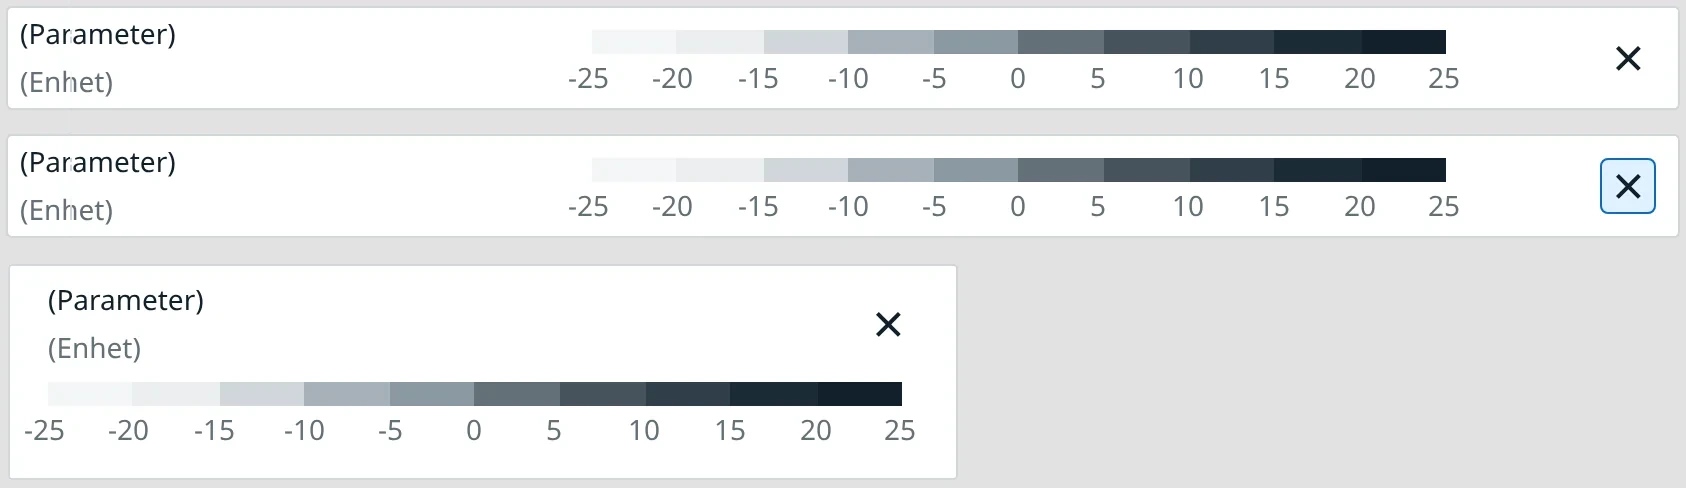
Problem: Legends appeared in the order the parameters were selected, which made them hard to compare.
Decision: A fixed order and a list structure, plus a narrow variant.
Effect: Faster, more consistent reading.
Control panel
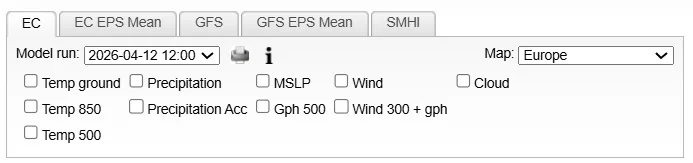
Problem: Tabs and checkboxes created visual noise, and selections were lost when switching models.
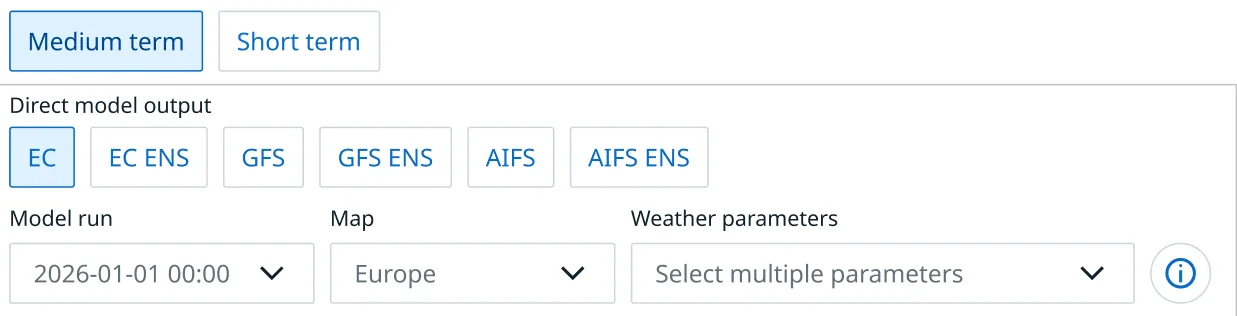
Decision: Dropdown menus, and selected parameters are kept between models.
Effect: A cleaner panel and less reselecting.
Time slider
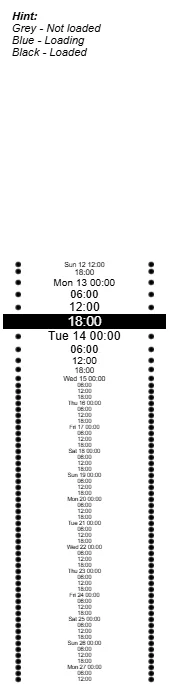
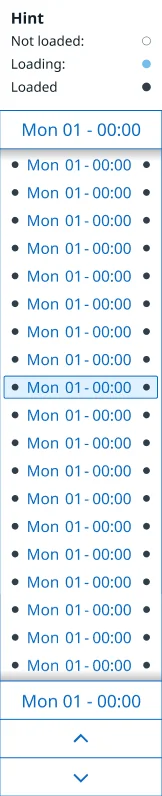
Problem: Many time values and a poor overview. The highest and lowest values weren’t visible at the same time, and you could only scroll by hovering.
Decision: Colour-coded dots, plus scrolling, arrow keys and buttons.
Effect: An instant overview and more ways to navigate.



The work went from requirements and discovery, through sketches and iterations, to delivery, in close dialogue with product owners and developers. Unused features, such as printing, were removed.
03 Design system & components
Aurora is SMHI’s design system and is used across several of their digital products. A central part of the project was integrating Aurora into Edgemontel. Since some components were missing, I created new ones based on Aurora’s principles, so the system stays consistent.
Legends
New legend components with improved data readability: a fixed order, consistent spacing and a list structure, plus a narrow variant for smaller screens.
Before (original)


After
Control panel
Built with existing Aurora components.
Before (original)
After
Time slider
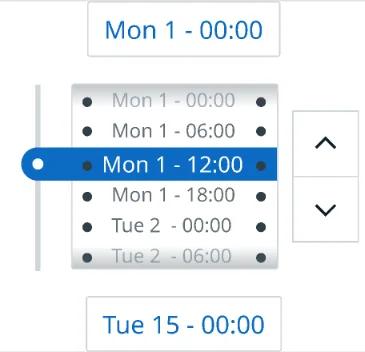
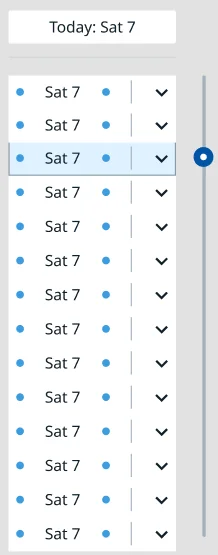
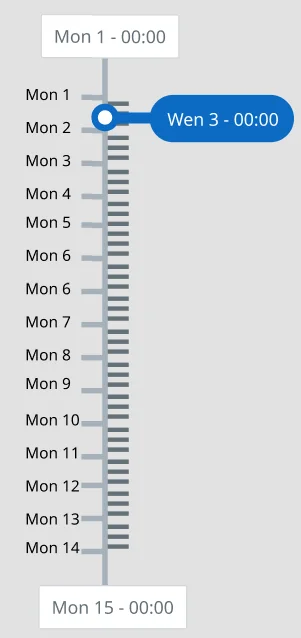
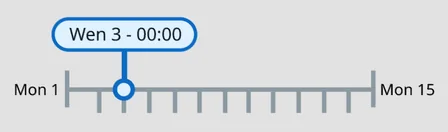
Four concepts before the final solution.
The time slider is built for high accessibility: you can scroll directly over the timeline, step with the arrow keys or use buttons. The colour of the dots shows whether there is data for that time value.
04 Comparison with the previous design
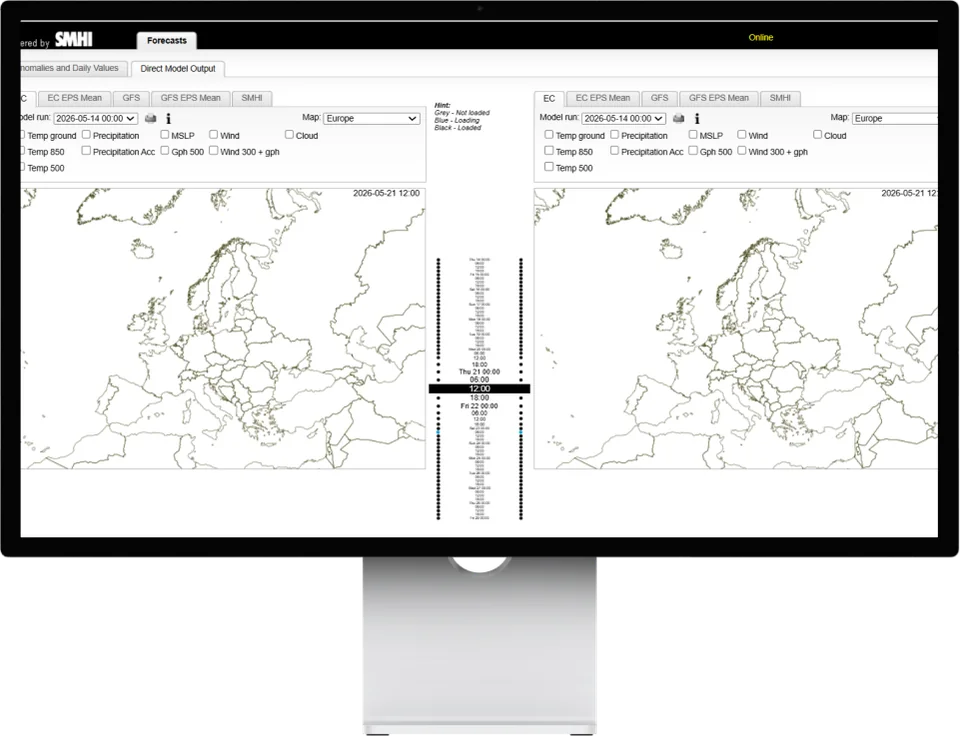
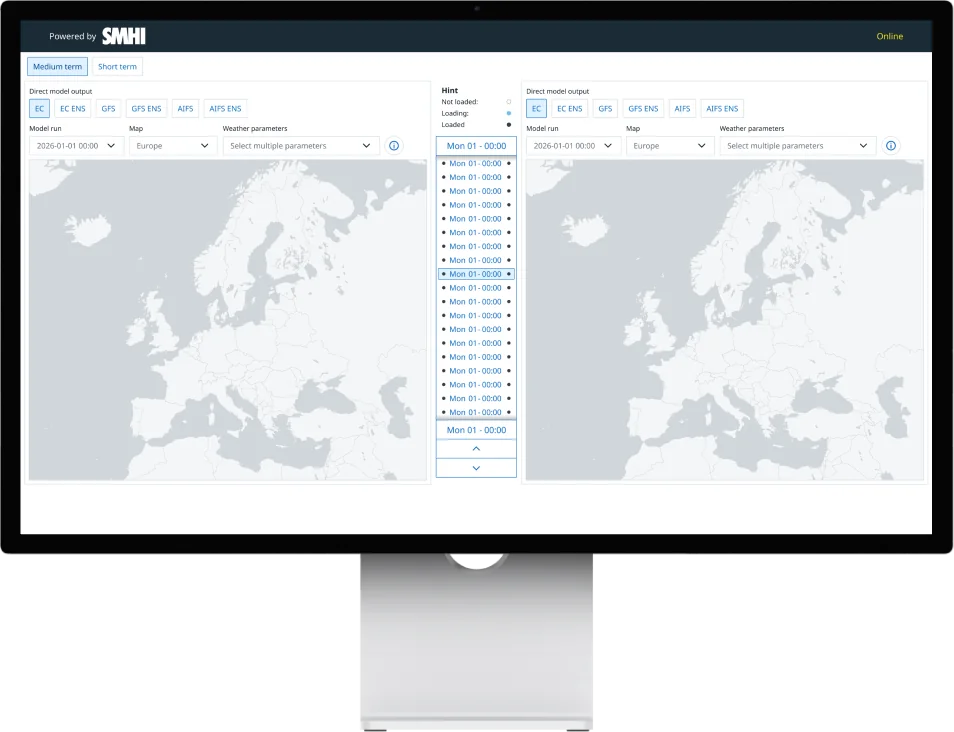
Below is a comparison of the previous and the new design, focusing on the improvements made.
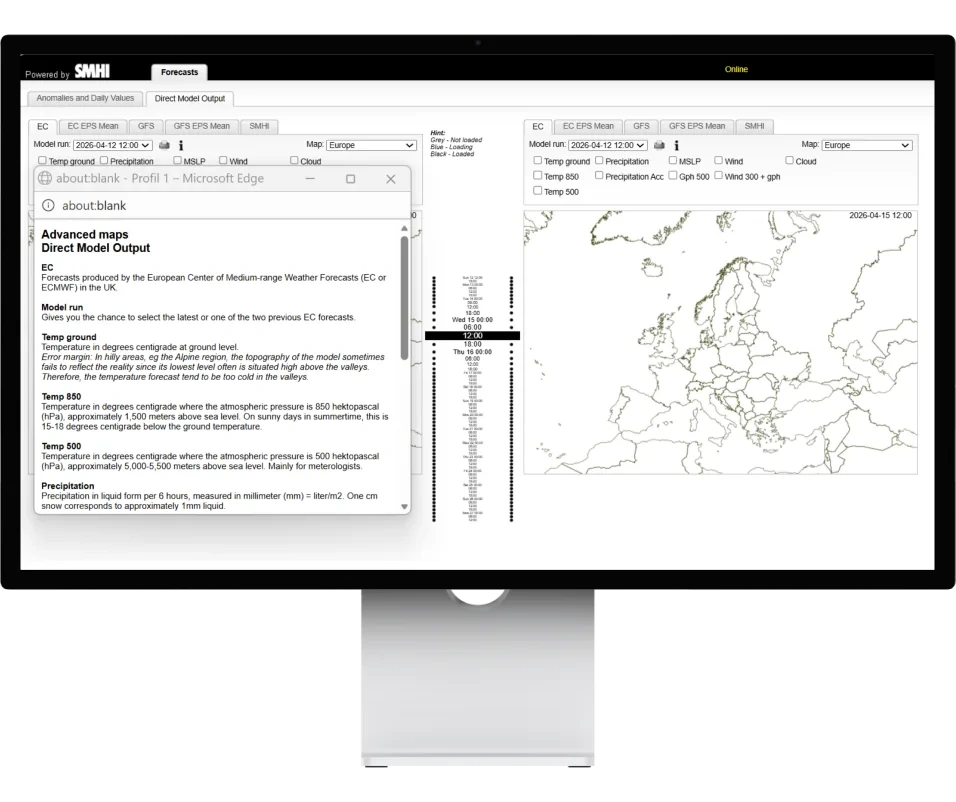
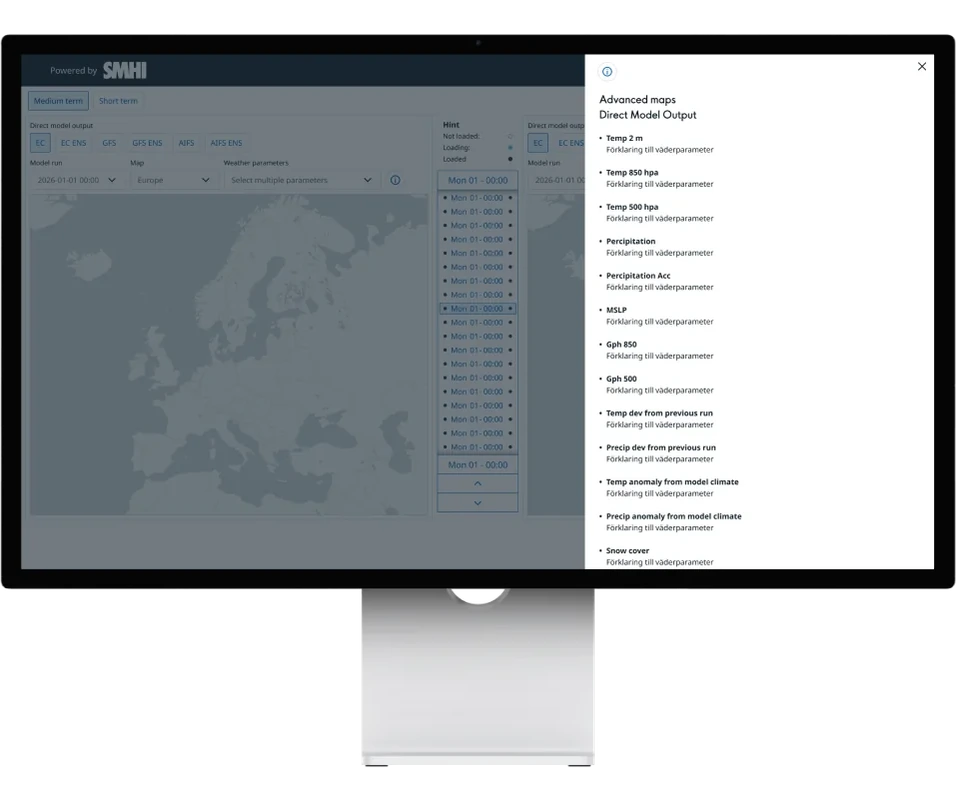
Info view
The pop-up window became a side panel, so the workflow isn’t interrupted.
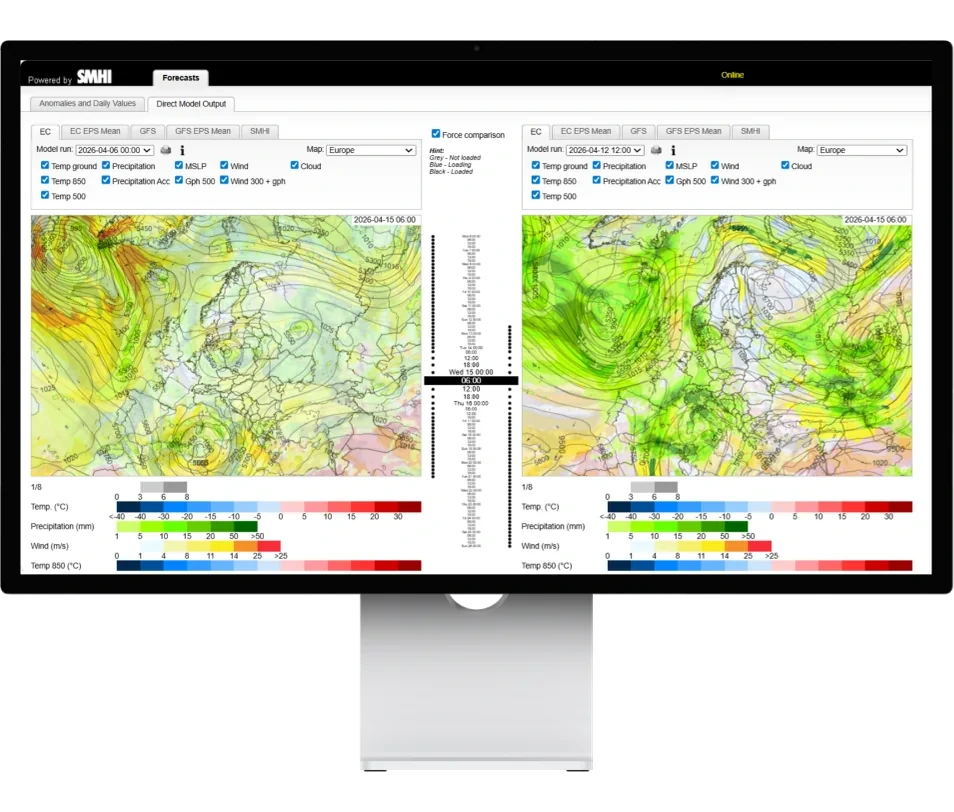
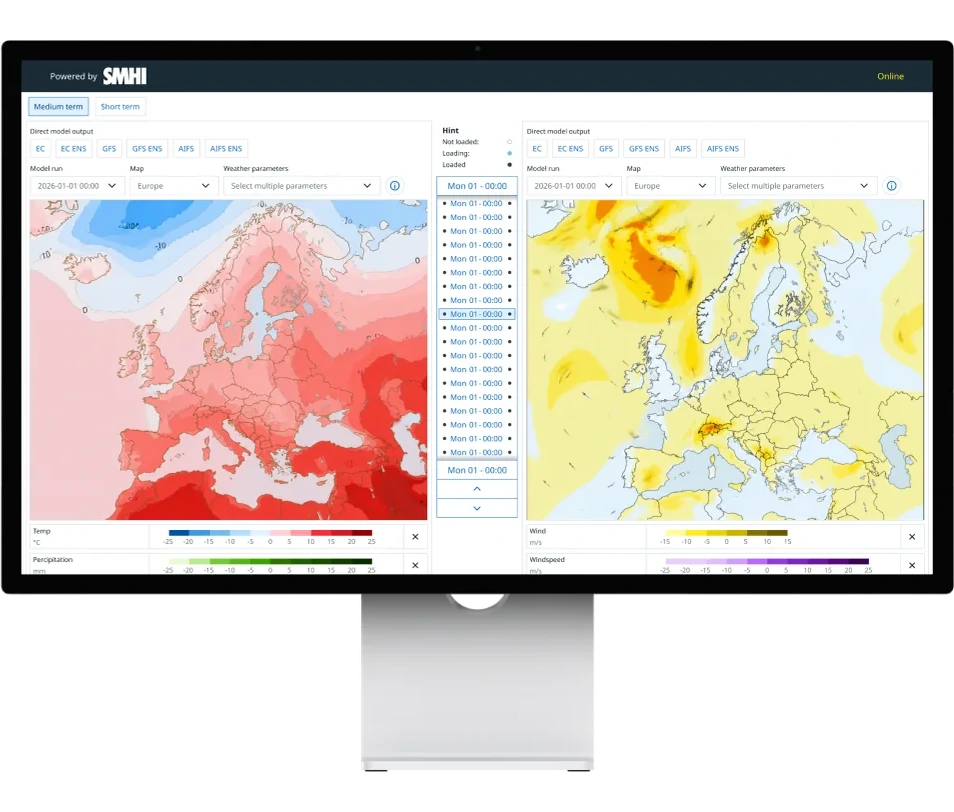
Selected weather parameters
The checkboxes became a dropdown menu, and selections are kept between models.
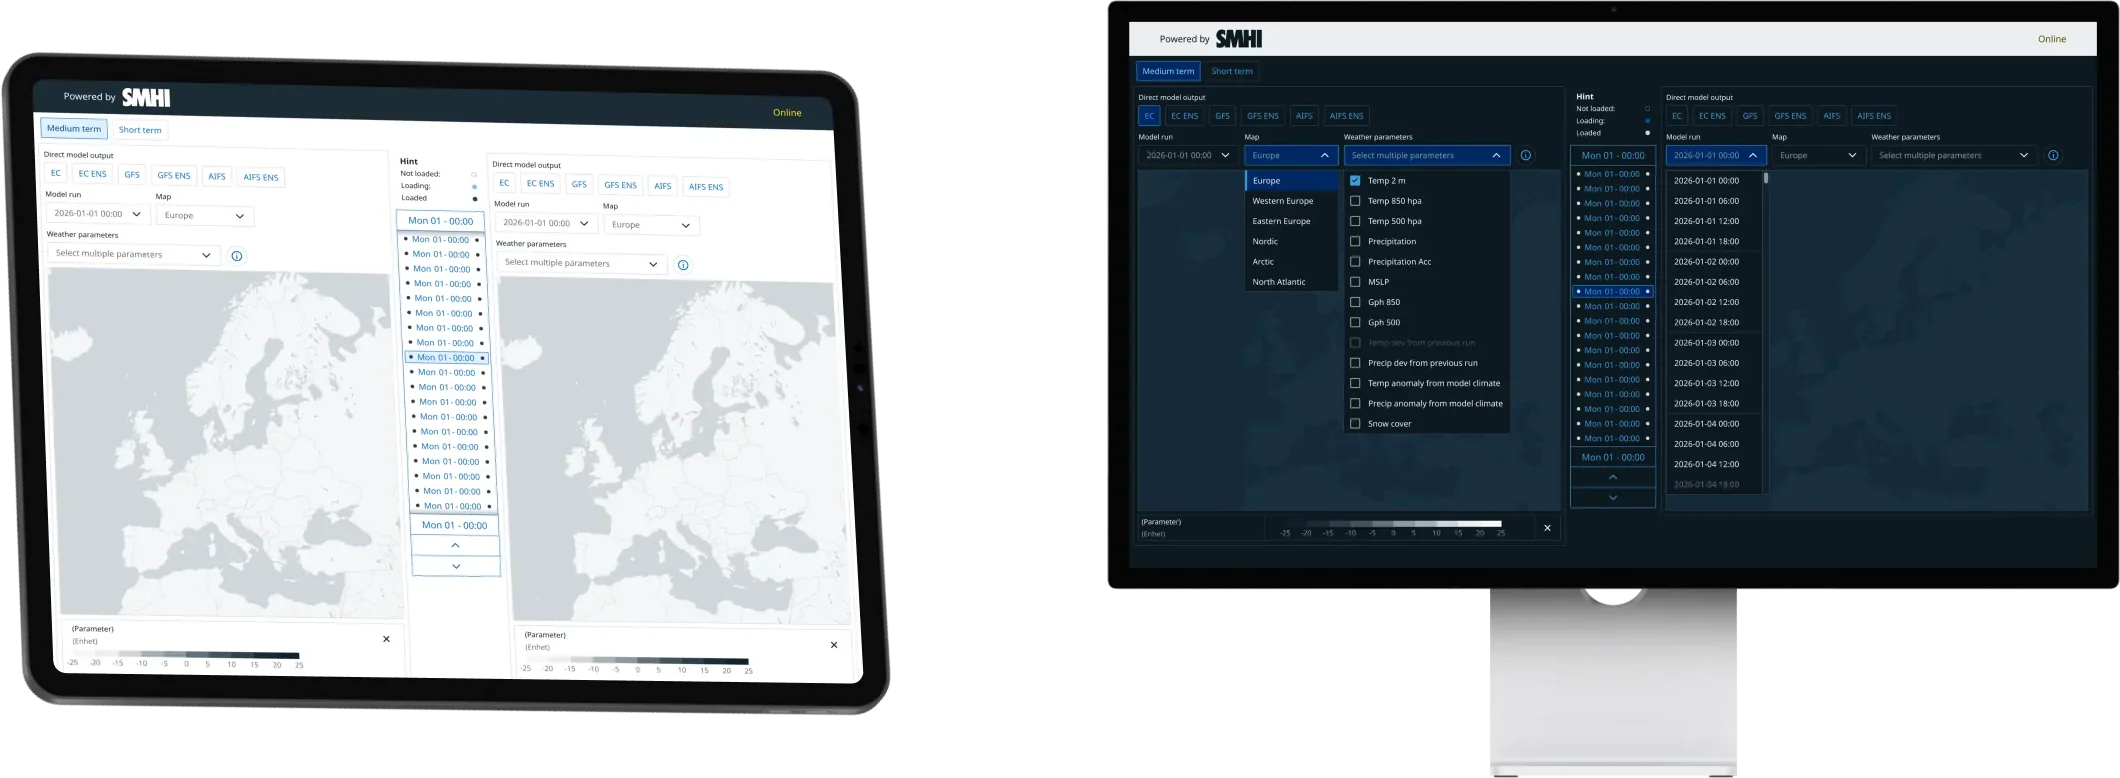
Responsiveness & dark mode
Now works on several screen sizes and has a dark mode version, thanks to Aurora.
05 Results
The result is a more compact and accessible interface with a clearer hierarchy and better feedback. The design has been handed over to development.
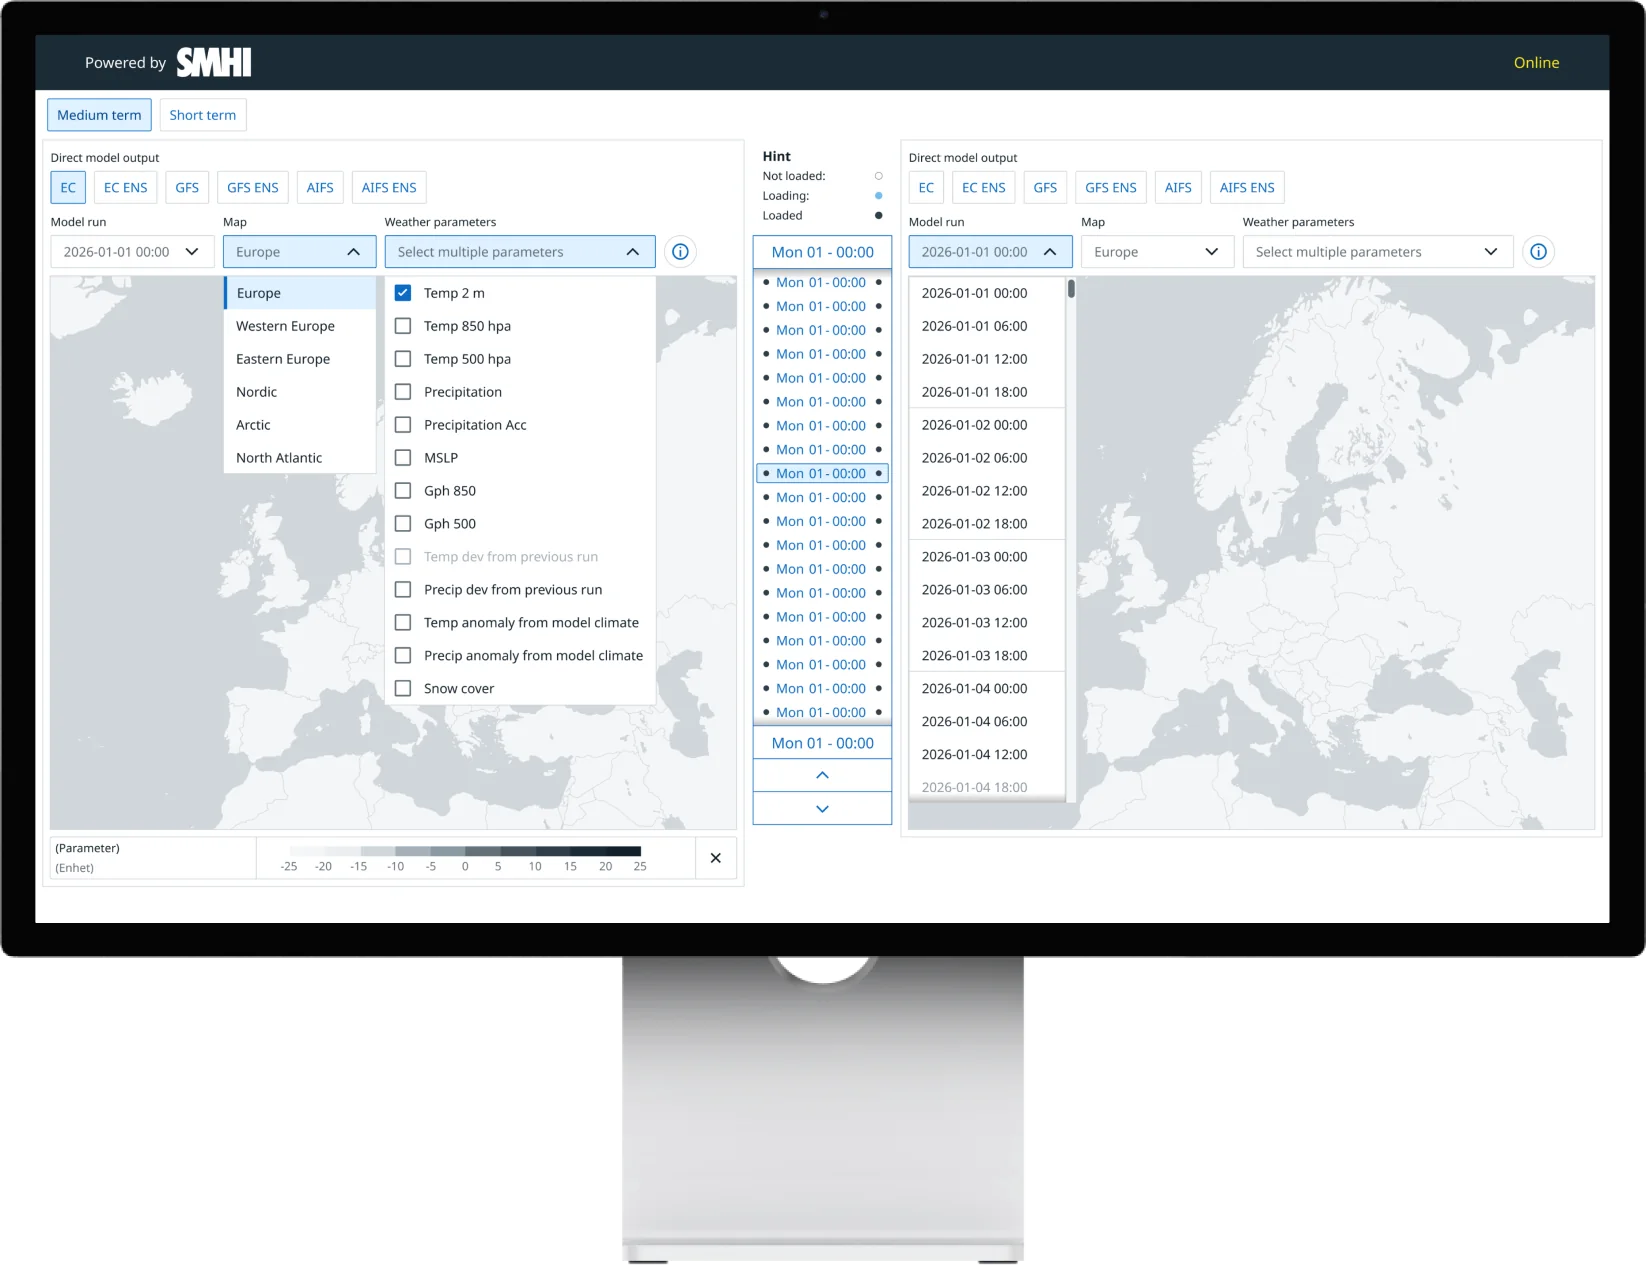
- Time interval Users can switch between hourly view and 6-hour intervals to adapt the analysis to their needs.
- Weather models Updated selection of weather models, map areas and weather parameters.
- Unavailable options Indicated immediately when data is missing.
- Scroll on the map Users can scroll directly over the map to quickly move between time values in the time slider.
- Legends Legends used to appear in the order the user selected weather parameters. The new solution organises them in a predefined structure for greater consistency and a faster overview.
- Dropdown menu For choosing weather parameters.
- Info button Integrated; the outdated print function is removed.
- Time slider New and accessible, designed to Aurora’s guidelines.
- Model runs Grouped by day for a better overview and easier analysis of values.
- Shortcut To quickly deselect weather parameters.